
Knowing the internal structure of building materials is very important for us, as it greatly influences the properties and durability of the materials. The internal structure of materials contains a lot of additional information, which could only partially be examined with analytical methods. In computer tomography (CT) scans, the subject of the examination is visible in slices. The image produced from the data matrix is essentially a density map of the given materials. On this density image, the elements of the examined object with different densities are clearly outlined, allowing for the identification of components with varying densities. By playing the slices in succession, we can virtually see into the structure of the material, and we can also represent the examined material in three dimensions.
Within the framework of this article, we would like to review how CT scans can be practically used in the examination of building materials.
KEYWORDS: material testing, CT, material structure, non-destructive testing
1. INTRODUCTION
It is difficult to reliably obtain a non-destructive image of the small-scale (mm) spatial internal structure of building materials. With optical or electron microscopy, only a surface image can be obtained in a non-destructive manner. Traditional methods allow for the capturing of additional images of individual thin slices after sectioning the sample, but this is quite time-consuming, and the internal structure of the sample may change during slicing, making it challenging to reliably infer the original three-dimensional internal structure in most cases. Conventional X-ray images contain the projected image of the entire three-dimensional internal structure, but from these images, the true three-dimensional structure cannot be extracted. With X-ray computed tomography (CT), it becomes possible to image the entire three-dimensional internal structure without the need for sample preparation or chemical fixation. In CT scans, the subject of the examination is visible in slices. The image visualized from the CT data matrix can, as a first approximation, be treated as a density map corresponding to the slice resolution of the given materials. In this density image, the different components of the examined object (aggregate particles, pores, cracks) are clearly delineated. By playing the slices in succession, we can virtually see into the structure of the material. Knowing the internal structure of building materials is very important for us, as it greatly influences the properties and durability of the materials. By gaining insight into and understanding the internal structure of materials, we can obtain much supplementary information, the examination of which would only be partially possible with analytical methods.
Within the framework of this article, we summarize how CT scans can be practically used in the examination of building materials.
2. THE OPERATION OF COMPUTED TOMOGRAPHY (CT)
In the literature, CT examination is also known as computed tomography, a branch of radiological diagnostics. The word tomography refers to slicing. In tomographic images, the subject of the examination is visible in imaginary slices. Computed tomography is an advancement of the traditional X-ray fluoroscopy technique. CT devices also use X-ray radiation to create images, but instead of exposing film, they detect X-rays using detectors, and the reconstructed cross-sectional image is created using a computer from the electrical signals obtained from these detectors.
In a tomographic image, a thin, planar X-ray beam passes through the examined object. The detector placed behind the object senses along a line where and how much of the beam has been absorbed. The object is scanned from multiple directions in a given plane with the X-ray beam, and from the measured intensity curves, the details located in that plane (slice) emerge. The plane is then shifted, and the process is repeated by rotating around the object again. At the end of the procedure, the spatial structure of the examined object can be mapped. Here, “structure” refers to details distinguishable by their X-ray transmittance, meaning the arrangement of materials with different densities (Berényi, Bogner, Horváth, Repa, 1997).
The examination, including the necessary calculations, can be completed in a few minutes (Földes, 2011; Buzug, 2008). The complete evaluation involves additional significant tasks.
The measurement method is based on the different attenuation properties of materials. The μ attenuation coefficient is a property characteristic of the material, depending on its density and the spectrum of the X-ray radiation.
Each voxel (volume element) in CT images has an intensity value, representing the relative linear attenuation of the given volume element (Russ, 2011). In the next step, these values are assigned to a scale according to the following formula:
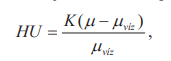
where:
HU a Hounsfield-Unit [-],
K a constant with a value of 1000 [-],
μ the attenuation coefficient of the given pixel,
μvíz the attenuation coefficient of water
The fixed points of the scale are the Hounsfield value of water, which is set to 0, and the Hounsfield value of air, which is -1000 Hounsfield units. The range of Hounsfield values typically spans from -1024 to +3071, but on modern devices, it is possible to extend the scale for a more detailed resolution.
Given that CT is primarily used to measure density differences, we must examine whether the phenomenon to be observed (e.g., material structural changes due to fire) causes a detectable density difference.
3. APPLICATION OF CT IN MATERIAL TESTING
The use of CT in medical diagnostics is now widespread, but its application in the field of material testing is still either not known at all or is less well-known. CT is used to measure density differences, so we need to examine in which areas of material testing density difference measurement is sufficient and which properties or material structural changes can be characterized by measuring density differences. Given that most building materials are inhomogeneous, meaning they contain density differences, their material structure can be effectively examined using CT. Furthermore, during material structural degradation, the density and structure of the materials change significantly, so these processes can also be studied with CT.
For our measurements, we used a third-generation CT device (Siemens SOMATOM Sensation 16), which illuminates the subject of the examination with a flat, fan-shaped X-ray beam.
During the research, evaluating the CT images presented a significant challenge. Due to the noise in the CT images, we applied image enhancement tools during the evaluation. These included various filters (such as an averaging filter), and we also had to specifically address beam-hardening correction, which is characteristic of CT.
On the images, materials with different densities were separated and segmented. The processing and analysis of the CT images were performed in an automated manner using algorithms written in the Matlab environment, with pre-set parameters.
The developed algorithms perform segmentation on the CT images individually and then, after analysis, produce slice-by-slice volumetric percentage statistics. Among the limitations of the method is that with medical CT, aggregate particles smaller than 0.4 mm cannot be segmented; their segmentation can only be achieved with micro or nano CT, but for building materials, these procedures are not or only hardly applicable due to the limited sample size.
3.1 Examination of Asphalt Using CT
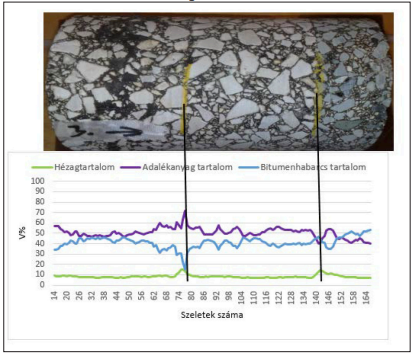
In the case of asphalt, the void content significantly affects the durability of the road pavement structure. Measuring the void content under laboratory conditions can be very costly and complicated. However, examining the void content with a CT device is relatively simple because the densities of the voids, aggregates, and bitumen mortar differ significantly from each other. In the case of an asphalt sample, the layer boundaries can be clearly identified based on the void content distribution (Figure 1), as the void content significantly increases at the layer boundaries. This is due to the application of a hot layer onto a cold asphalt surface during pavement construction, which creates a high-void area between the two layers during the integration process.
An important question may be how much the void content has increased at the layer boundaries. During laboratory measurements, cutting occurs before examining the test specimens, meaning no information is obtained from the area with increased void content. However, this part could provide information about the condition of the integration of the two layers and, therefore, the expected lifespan of the pavement structure.
In the case of asphalt, in addition to void content, aggregate particles larger than 4 mm are also well-segmented, and the shape and spatial distribution of the aggregates can be examined.
3.2 Examination of Concrete Using CT
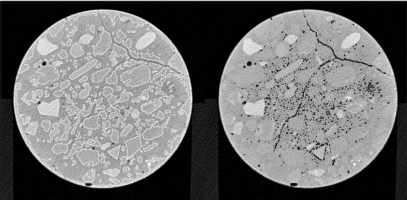
The examination of concrete is more complex than that of asphalt because the density of the aggregate and cement paste does not differ as significantly as in asphalt, making the segmentation of aggregate particles more challenging. In the case of a concrete sample, the pores can be clearly identified, allowing for the determination of the pore distribution in the specimen. It is crucial that the pore content in concrete can be relatively easily and clearly determined, as this is very important for durability issues. However, it should be noted that the examination of micropores, which significantly influences frost resistance, is only possible with higher-resolution micro-CT, where the sample size is limited (approximately a 1 cm cube). This limitation raises questions about the relevance of sampling for concrete.
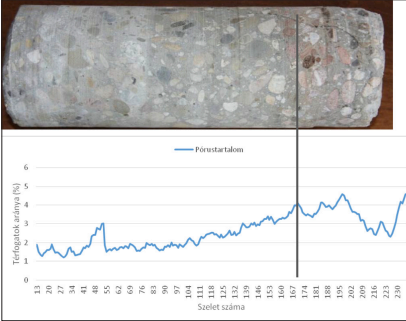
When examining material structure, various degradation processes can also be effectively tracked using CT. Figure 2 shows a slice of a core sample taken from fire-damaged concrete. The developed cracks are clearly visible in the images. In Figure 3, we have provided the aggregate content, mortar content, and pore content along the length of the sample. The peaks visible in the curves can be explained by variations in aggregate and mortar content within the slices. It is evident that porosity increases from slice 100 onwards, so we have separately plotted the pore content. Figure 3 shows that the upper 100 mm thickness of the concrete surface can be considered damaged, indicating a reduction in strength.
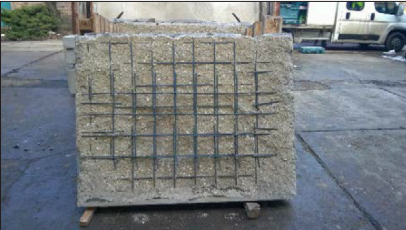
Figure 4 shows wall panel elements after fire testing. The concrete cover on the wall panel elements has detached. The reason for the detachment of the concrete cover was the high strength of the concrete (C 30/37) and the type of cement used (CEM I 52.5 R).
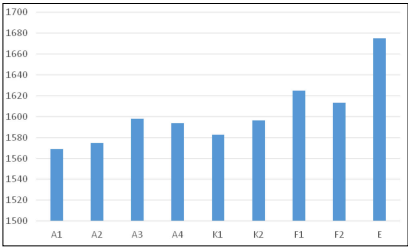
After the fire test, core samples were taken from the wall panel elements. During sampling, care was taken to take samples from characteristic locations, so four core samples were taken from the lower element, which was the most damaged, and 2 samples each from the middle and upper elements. The samples were subjected to CT examinations. The results of the CT examinations are presented in Figure 5. The column chart shows the average HU values measured on the core samples. Based on the column chart, it can be concluded that the degree of damage is correlated with the determined HU value. In the more damaged areas, the HU value clearly decreased. Based on this, it can be determined that even if the concrete surface has detached, the fire load and the degree of damage can be determined using CT measurements.
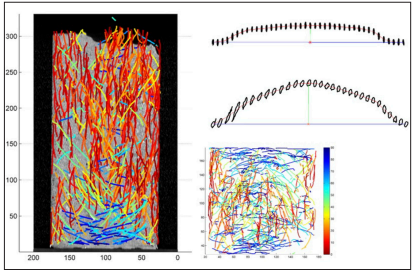
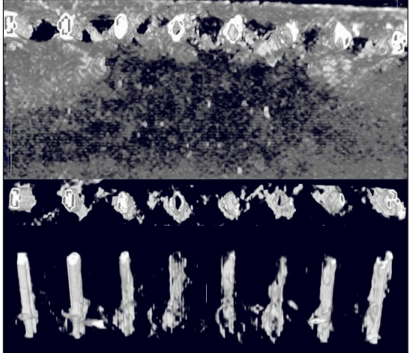
In the case of fiber-reinforced concretes, the positioning of the fibers is very important, as this affects the load-bearing capacity of the structure. To study the effect of fiber content and mixing time on fiber orientation and placement, CT examinations were performed on fiber-reinforced concretes (Figure 6). The CT examination was performed on one half-beam from a mixture mixed for 5 minutes after fiber addition with 0.3 V% fiber content and 0.5 V% fiber content, and one half-beam from a mixture mixed for 30 minutes after fiber addition with 0.5 V% fiber content.
Based on the CT images, the following observations were made:
- Changing the fiber content did not significantly affect fiber placement. A longer mixing time in concrete (30 minutes instead of 5 minutes) resulted in a more uniform fiber distribution, but it did not completely eliminate local fiber agglomerations.
- The orientation of the fibers was significantly influenced by the amount of fiber added to the concrete. At higher fiber content (0.5 V%), the fibers became directionally aligned in layers.
- During our investigations, we demonstrated that on the molded sides of 150×150×600 mm specimens, the fibers aligned in the direction of the mold, while in the middle of the specimen, they were randomly oriented.
- The change in mixing time did not significantly affect fiber orientation. However, minor changes made during placement and compaction had a significant impact.
- We demonstrated that some steel fibers could deform due to mixing in the concrete. The degree and frequency of deformation only slightly increased with longer mixing times (30 minutes instead of 5 minutes) (Balázs, Czoboly, Lublóy, Kapitány, Barsi, 2017).
- figure : Asphalt Specimen: Distribution of Aggregate, Void, and Binder Content, as well as Identification of Layer Boundaries
2. figure: Concrete Specimen: Aggregate (white outline) and Pore System (black outline) on CT Layer Images
3. figure: Distribution of Pores Within Individual Slices
4. figure: Damage to the Lower Wall Panel Element After the Fire
5. figure: Average HU Value of Core Samples from Drilled Wall Panel Elements (A: lower panel element, K: middle panel element, F: upper wall panel element, E: panel element without fire exposure)
3.3 Examination of Reinforced Concrete Water Pressure Pipe
For reinforced concrete structures, it is crucial to obtain as much information as possible about the corrosion condition of the steel reinforcements. The condition of the steel reinforcements, which can only be assessed after the removal of the concrete cover, is particularly important for evaluating the future load-bearing capacity. In this study, the question was what lies beneath the rust spots already visible to the naked eye.
The CT scan clearly shows that the steel reinforcements have broken (Figure 7). We also observed damage to the concrete (cavitation) under the large rust spot. Images were taken of the immediate vicinity of the cavity. It can be concluded that a region of lower density is visible around the steel reinforcements, likely causing the damage.
Figure 7 also shows the cross-section of the broken steel reinforcements. The images reveal that cavitation has occurred in the middle of the steel reinforcements (Czoboly, Lublóy, Balázs, Zimmer, 2014).
6. figure: Analysis of Fiber Distribution in Steel Fiber-Reinforced Concrete Using CT
3.4 Examination of Asbestos-Cement Water Pipe
Another question is whether CT is also suitable for the material testing and mapping of the degradation of other building materials. In this study, we examined a well-known type of water pipeline, asbestos-cement pipes.
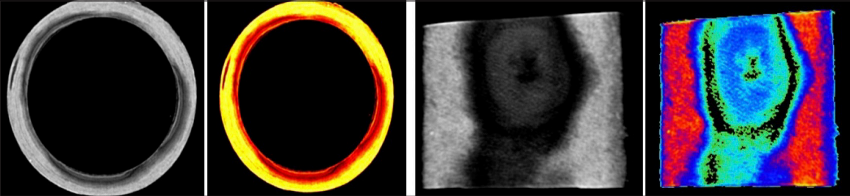
Figure 8 shows a computed tomography (CT) scan of an asbestos-cement pipe. The CT scan reveals a thinning of the load-bearing part of the pipe at the damaged area (Figure 8a). After modifying the colors of the CT image, the differences in shades become more discernible, making the detached surface clearly distinguishable on the CT images, as well as on the photographic image of the cross-section. In Figure 8a, the lighter colors indicate areas with higher Hounsfield values (density), while the darker areas correspond to regions with lower density. A decrease in density always suggests some form of material structural degradation.
Figure 8b shows the environment around the damaged area. It is clearly visible that the density value of the damaged area has significantly decreased. This decrease in density does not occur uniformly but rather in layers. This layered decrease in density explains why other non-destructive tests are quite difficult to perform.
7. figure: Examination of Sentab Pipes Using CT
4. SUMMARY
In this article, we briefly reviewed how CT scans can be effectively used for the examination of building materials. Our investigations included asphalt, concrete, reinforced concrete, and asbestos-cement elements.
Based on the results of our research, we can conclude that:
- CT is suitable for mapping the internal structure of porous building materials, naturally considering the slice thickness and image resolution used during the measurement and adhering to the limitations that arise.
- CT is suitable for tracking structural changes (degradation) occurring in materials.
- CT is suitable for assessing the corrosion condition of steel reinforcements without removing the concrete cover.
5. ACKNOWLEDGMENTS
The authors of this article would like to express their gratitude for the research support received through the NVKP_16-1-0019 project titled “Material science and experimental development of concrete products with enhanced resistance (chemical corrosion resistance, fire resistance, and frost resistance).”
This work was supported by the Ministry of Human Resources under the ÚNKP-18-4 New National Excellence Program.
8. figure: CT Examination Results of Asbestos-Cement Pipe (a. Cross-section, b. The environment around the damaged area)
6. REFERENCES
Balázs, L. Gy., Czoboly, O., Lublóy, É., Kapitány, K., Barsi, Á. (2017), „Observation of steel fibres in concrete with Computed Tomography”, ConstructionandBuildingMaterials140, pp. 534- 541., https://doi.org/10.1016/j.conbuildmat.2017.02.114
Berényi E., Bogner P., Horváth Gy., Repa I. (1997), Radiológia. Springer Hungarica, Budapest, 1997 Buzug, T. M. (2008),
„Computed Tomography – From Photon Statistics to Modern Cone-Beam CT”, Berlin/Heidelberg : Springer-Verlag, 978-3- 540-39407-5.
Czoboly O., Lublóy É., Balázs L. Gy., Zimmer P. (2014), „Leromlási folyamatok Sentab Típusú nagy átmérőjű feszített vasbeton nyomócső esetén”, Konferencia Kiadvány, XVIII. Nemzetközi Építéstudományi Konferencia: ÉPKO 2014. Csíksomlyó, Románia, 2014.06.12-15, Kiadó Erdélyi Magyar Műszaki Tudományos Társaság (EMT) Kolozsvár, pp. 46-49.
Földes T. (2011) Kőzetkarakterizáció röntgen computer tomográf (CT) mérésekkel végzett hidrodinamikai vizsgálatokkal, Újdonságok a geotermikában: Geotermikus koordinációs és innovációs alapítvány időszakos kiadványa, pp. 25-42.
Lublóy É., Ambrus D., Kapitány K. (2014), „Aszfalt összetétel vizsgálata CT-vel”, Konferencia Kiadvány, XVIII. Nemzetközi Építéstudományi Konferencia: ÉPKO 2014. Csíksomlyó, Románia, 2014.06.12-15, Kiadó Erdélyi Magyar Műszaki Tudományos Társaság (EMT) Kolozsvár, pp. 186-189.
Russ, J. C. (2011), „Image Processing Handbook”, Book, Sixth Edition, ISBN: 1-4398-4045-8, CRC Press
Dr. Éva Lublóy (1976) is a certified civil engineer (Budapest University of Technology and Economics, Faculty of Civil Engineering, 2001) and an associate professor at the Department of Construction Materials and Engineering at the Budapest University of Technology and Economics (since 2008). Her main areas of interest include the behavior of reinforced concrete structures under fire and engineering lessons from fire damage. She is a member of the Hungarian Chapter of fib (International Federation for Structural Concrete).
Dr. L. György Balázs (1958) is a certified civil engineer and an engineering mathematics specialist with a PhD and Dr. habil. He is a university professor and the head of the Department of Construction Materials and Engineering at the Budapest University of Technology and Economics. He is also a candidate of technical sciences at the Hungarian Academy of Sciences. His main research areas include concrete, reinforced concrete, and prestressed concrete structures (materials, laboratory testing, and modeling), as well as non-destructive testing. He specializes in special concretes and reinforcements: fiber-reinforced concretes (FRC), non-steel (FRP) reinforcements, strengthening materials and methods, HPC, UHPC, and LWC. His work also covers fire-resistant design, enhancing fire resistance, improving frost resistance, increasing chemical resistance, durability, service life, sustainable construction, force transmission in concrete, the crack state of reinforced concrete beams, fatigue, impact loading, and nuclear facilities. He served as the president of the International Federation for Structural Concrete (fib) from 2011 to 2012 and is currently its honorary president. He is the president of the Hungarian Chapter of fib and the founder of the International PhD Symposium in Civil Engineering. He also chairs fib Commission 9, “Dissemination of Knowledge.”
Tamás Földes (1954) is a certified geologist (Eötvös Loránd University, 1979). Until 2005, he worked at the Oil Research Company and then at MOL Plc. Since 2006, he has been an employee of the Diagnostic Institute of Kaposvár University. Since 1999, he has been conducting CT and MR measurement evaluations on inanimate materials, primarily rocks. His main areas of interest include hydrocarbon reservoirs, geological modeling, high-resolution non-destructive imaging techniques (CT, microCT, MR), and the evaluation of inanimate material testing methods. He is a member of the Hungarian Geological Society, the Geophysical Society, and the European Association of Geoscientists and Engineers (EAGE).
Dr. Kristóf Kapitány (1987) holds a BSc in Civil Engineering (Surveying and Geoinformatics) (Budapest University of Technology and Economics, Faculty of Civil Engineering, 2009) and an MSc in Surveying and Geoinformatics Engineering (Budapest University of Technology and Economics, Faculty of Civil Engineering, 2012). He is a PhD student at the Department of Photogrammetry and Geoinformatics at the Budapest University of Technology and Economics. His main areas of interest include image processing, medical imaging, and object reconstruction from medical images.
Viktor Hlavička (1987) is a certified structural engineer (MSc), concrete technologist, and fire protection planning specialist. He is a PhD candidate at the Department of Construction Materials and Engineering at the Budapest University of Technology and Economics. His main areas of interest include anchoring techniques, the behavior and finite element modeling of mechanical and adhesive anchors in concrete, and engineering lessons from fire-damaged structures and materials. He is a member of the Hungarian Chapter of fib.
POSSIBILITY OF APPLICATION OF CT IN CASE OF BUILDING MATERIALS
Dr. Éva Lublóy – Dr. György L. Balázs – Tamás Földes – Dr.
Kristóf Kapitány – Viktor Hlavička
Keywords: material testing, CT, material structure, non-destructive testing
Detailed information on the internal structure of building materials is highly important for us, as it highly affects properties and durability of materials. Some information about the internal structure can only partly be obtained by analytical methods.
Images generated during a computer tomograhic (CT) scanning are able to show sections of the specimens. The images that are constructed by a data matrix show the density distribution of the material tissue. Elements that have different density are visually separated and, therefore, can be clearly identified. If the sections are displayed in a line then the internal structure can be visualized in 3D.