Asphalt testing
(Quality assurance during the construction of the M6 motorway)
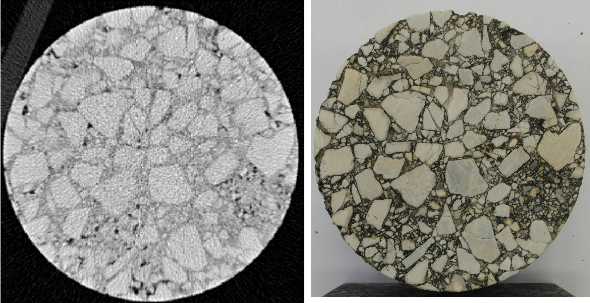
With the help of CT, it will be possible to determine the particle distribution of additives within the layers, which cannot be determined with laboratory tests. In addition to all this, it is also possible to examine damaged (cracked, rutted) structures, which could not have been done with laboratory tests. The extent of the damage can also be determined, so their repair becomes easier. Due to its digital form, the 3-dimensional image produced by CT can also be used for finite element modeling, which can be used to estimate and calculate the load capacity of the roadway structure. Materials of different densities were separated and segmented in the recordings.
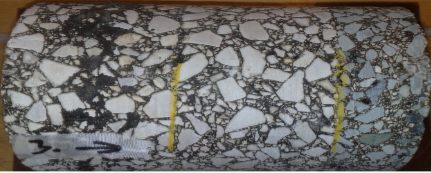
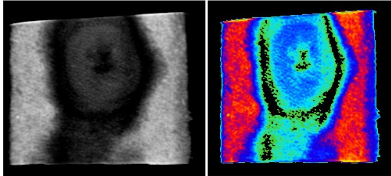
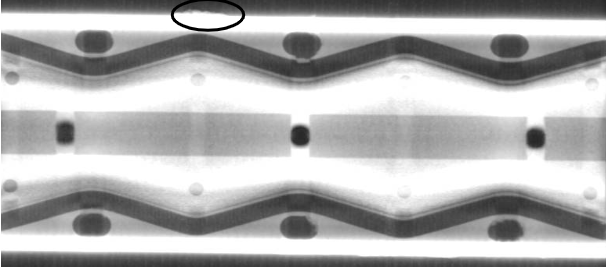
In the case of an asphalt sample, the layer boundaries can also be clearly identified based on the distribution of the void content, since the void content increases significantly at the layer boundaries. The reason for this is that a warm layer is applied to a cold asphalt surface during the preparation of the pavement, and during the mixing process, a gap rich layer is created inbetween.
a) A cross-sectional CT image and a cross-sectional cut view of the same area
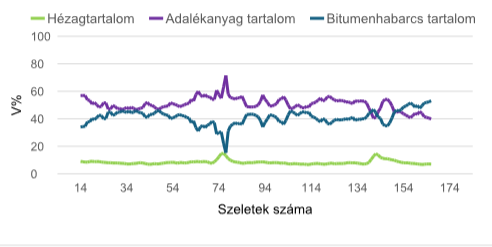
b) Distribution of additive, joint and binder content in an asphalt sample, and identification of layer boundaries
Segmentation and evaluation of the sample based on CT assumptions (Lublóy, Ambrus, Kapitány, Barsi, 2015; Lublóy Ambrus, Kapitány, 2014, Lublóy, Földes, Ambrus, Kapitány, Barsi, 2014, Lublóy, Ambrus, Földes 2014)
Examination of asbestos cement pipe (Fővárosi Vízművek Zrt)
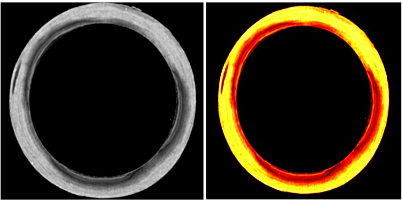
In the CT image of the asbestos-cement pipe, thinning of the load-bearing part of the pipe can be seen in the damaged area. After adjusting the sharpness of the CT image, the detached surface can be clearly distinguished on the CT images, as well as on the photograph of the section. In the image, lighter colors indicate areas with a higher Hounsfield value (density), and darker areas indicate areas with a lower density. We can always infer some kind of structural deterioration from the decrease in density.
a) Cross-section of the asbestos pipe
b) Surroundings of the damaged area
Photographs of the asbestos pipes (BME, 2012)
We can see the surroundings of the damaged part. It is clear that the density of the damaged area has decreased significantly, which means that the density of the material has also decreased significantly. The decrease in density does not occur uniformly, but in layers. This layered decrease in density explains the fact that other non-destructive tests are quite difficult to perform.
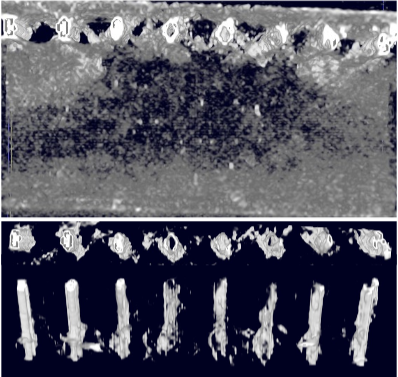
In the CT scan of the SENTAB (prestressed reinforced concrete pipe) pipes, it is clearly visible that under the rusted spots (3 spots) the steel inserts are torn. Damage (cavitation) of the concrete was also observed under the large rust spot. We took pictures of the immediate surroundings of the cavity. It can be established that a lower density part is visible in the surroundings of the steel inserts. In the cross-section images of the torn steel inserts, it can be observed that there is a hollowing out in the middle of the steel inserts, which is similar to what was observed in the pipe break on Orlay Street (BME, 2012).
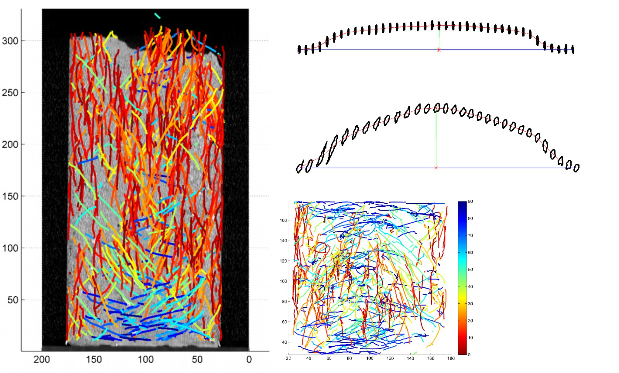
In order to examine the effect of fiber content and mixing time on fiber orientation and fiber placement, a CT scan was performed on fiber-reinforced concrete (Picture 3.4). The CT examination was performed on 1 half-beam made of 0.3 V% fiber mixture and 0.5 V% fiber mixture mixed for 5 minutes after fiber addition and 1 half beam made of 0.5 V% fiber mixture mixed for 30 minutes after fiber addition.
Based on the CT scans, we observed the following:
Changing the fiber content had no significant effect on the fiber arrangement. The longer mixing time of the fibers in concrete (30 minutes instead of 5 minutes) resulted in a more uniform fiber distribution, but did not completely eliminate local fiber bundling.
The orientation of the fibers was significantly influenced by the amount of fiber added to the concrete. In the case of a higher (0.5V%) fiber content, the fibers have already become layered.
We have shown that some of the steel fibers can be deformed as a result of mixing in concrete. The extent and frequency of deformation increased only slightly due to longer mixing (30 minutes instead of 5 minutes).
During our tests, we showed that the fibers on the shuttered sides of the specimens with an edge length of 150×150×600 mm were arranged in the direction of the shuttering, while in the middle of the test case they were randomly oriented.
Changing the mixing time had no significant effect on fiber orientation. However, minor changes in processing and compression had a significant effect.
Fiber distribution analysis of steel fiber reinforced concrete
Examination of fire-damaged structures with CT (NVKP project)
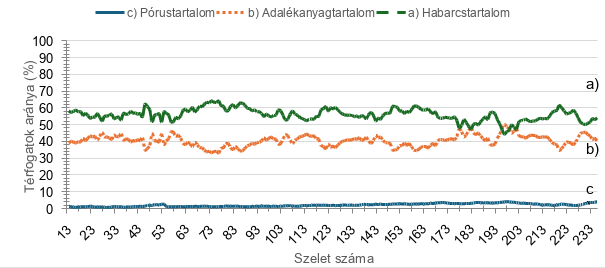
In the recordings, the additives, cement mortar and pores were separated. The developed algorithms perform the segmentation on the CT images one by one, and after analysis, we generate the volume percentage statistics for each slice. The results are recorded in tabular form and provide the opportunity for further statistical calculations, not only per slice, but also for the entire core sample. We can specify the additive content, mortar content and pore content. The peaks visible on the curves can be explained by the fact that the additive and mortar content can be different within the slices.
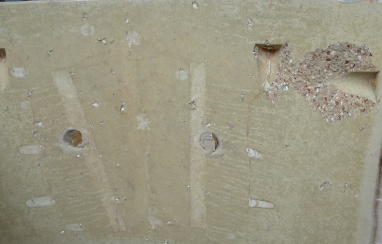
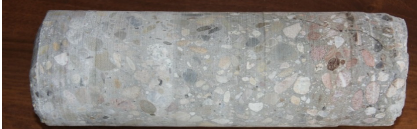
Sampling locations on fire-damaged structures (photo, Balázs Lublóy, Földes, 2015)
A sample taken from the fire-damaged structure (photo, Balázs Lublóy, Földes, 2015)
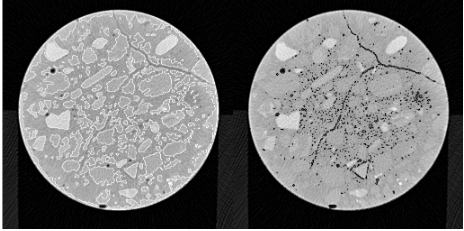
CT scan of the additive (white outline) and pore system (black outline).
The distribution of aggregate, cement stone and pores within each slice
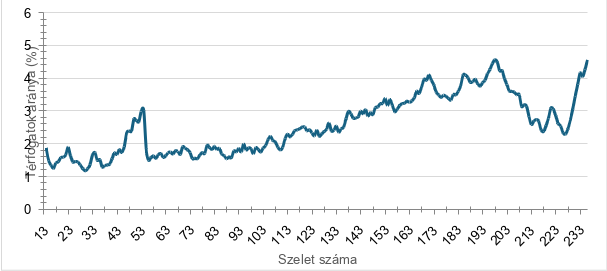
The distribution of pores within each slice
The spatial evolution of the pore system clearly shows that a crack runs along the lower third of the test specimen, where the concrete was exposed to the fire load, and that the pore system of the concrete has changed in the lower part exposed to heat load. In the lower part of the core sample, the number of small pores has increased significantly, presumably the change in the pore system causes the difference in body density determined during the analytical measurements. The decrease in body density indicates the degree of fire damage. Based on these, we can conclude that CT provides a good opportunity for examining fire-damaged buildings.
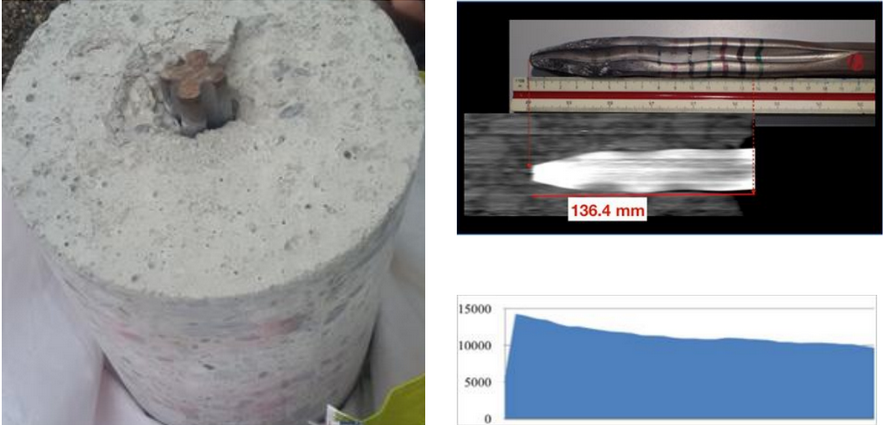
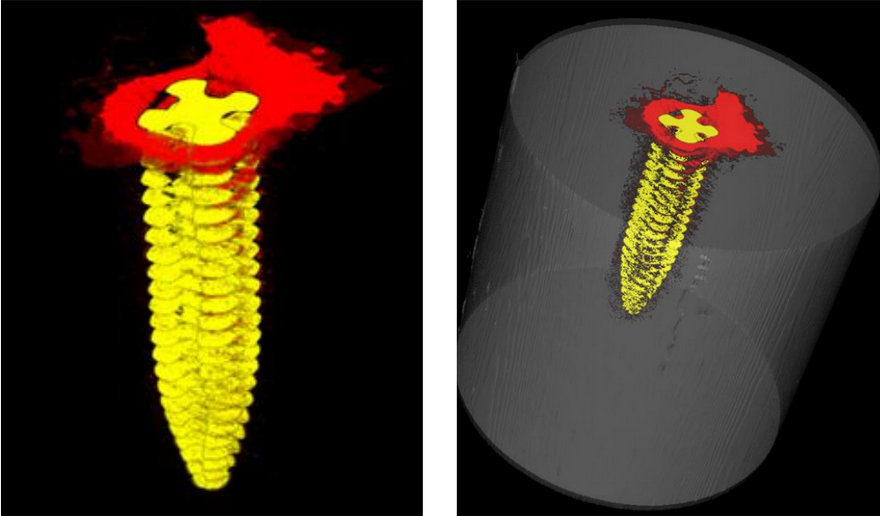
When using HILT’s newly developed drill, the head sometimes breaks into concrete. Our task was to investigate the cause of this failure. The subject of our investigation is a broken drill bit protruding from a concrete slab.
Density distribution of the broken drill
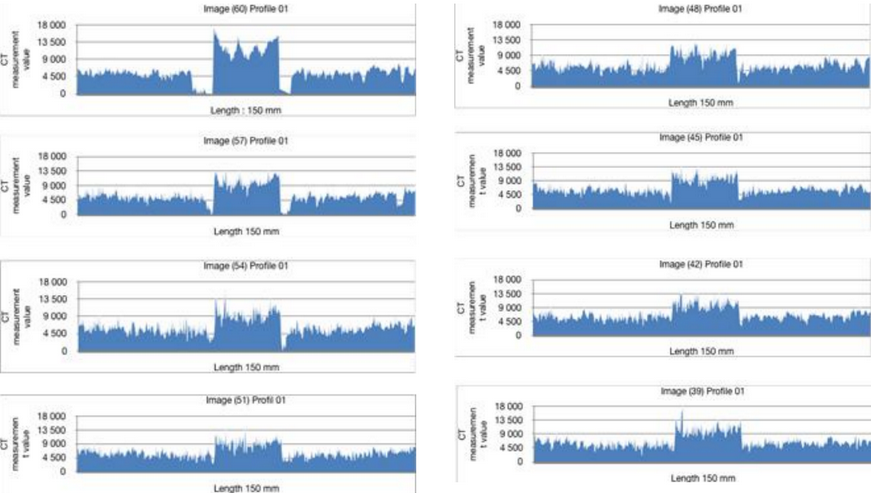
We created the density distribution perpendicular to the drill at 10 mm intervals. In the next graph the distribution is shown in the first 8 mm. In the first diagram, you can see a reduced density at the drill (higher values in the middle). The same trend can be observed in the next 3 diagrams. After 4 cm, the dissolution of the concrete is barely noticeable. We can see that the decay of the concrete structure is greatest in the first 40 mm and in the case of greater penetration depth it is significantly smaller.
Length of cross section: 150 mm Pore distribution and density distribution in different areas
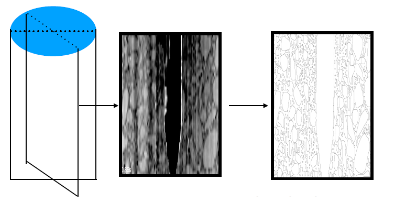
Segmentation of aggregate particles
(larger than 4 mm)
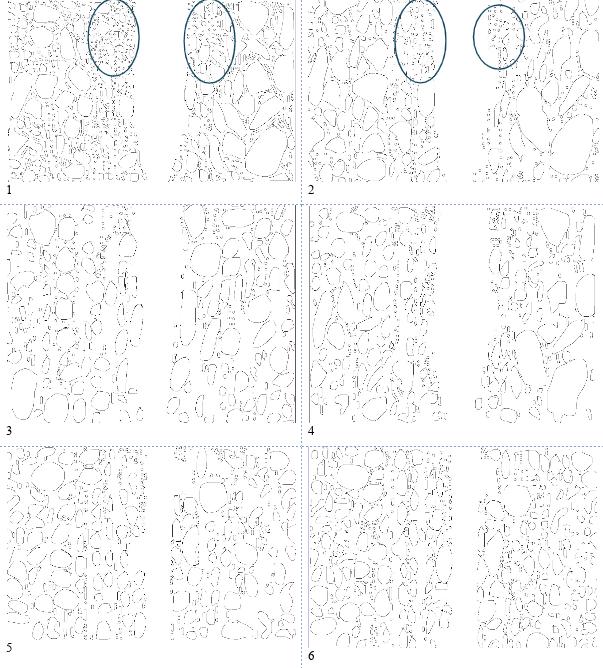
Cutting points were made perpendicular to the drill axis. The cutting points were rotated by 60°. The cutting points created in this way are shown in Picture 4.
Method of selection of cutting slices
Picture 4 shows the grain distribution on this cutting plane. In the 1st and 2nd positions, the upper part is more porose, as the grains have become significantly smaller.
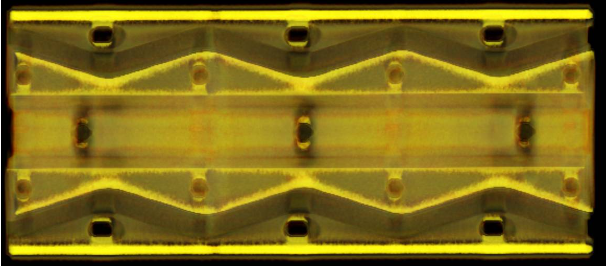
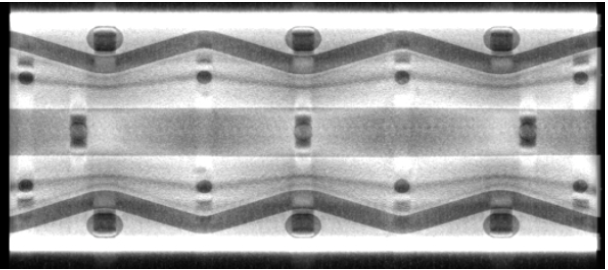
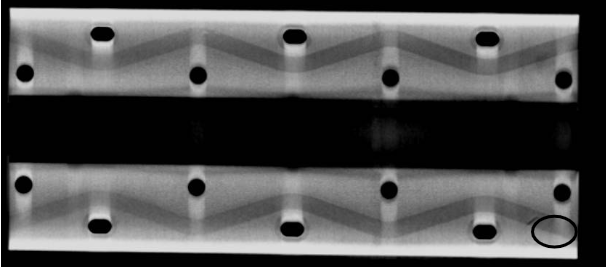
Top view of the intact specimen (CT scan) The steel elements can be clearly seen, just as the breaks in the elements, which appear as defects later in the samples (see chapter 2).
The rubber surface on the intact specimen (CT scan) We can see that the intact sample is evenly covered by the rubber material.The rubber surface on the intact specimen (CT scan)
a,
b,
c,
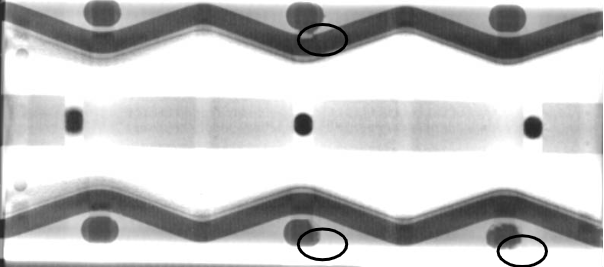
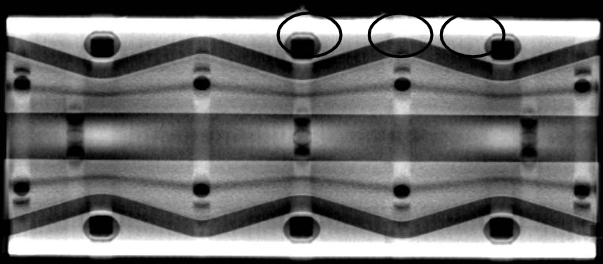
Faults of Sample 2 (CT scan)
We can see the errors found in sample 2. The rubber material has protruded in the vicinity of the fixings, which can presumably be traced back to mechanical damage (3.16 a). The separation of the rubber material from the metal surface can also be observed at the edge of the element (3.16 b). A crack can also be seen on the rubber, which led to the corrosion of the metal parts and later to the separation of the rubber (3.16 c).
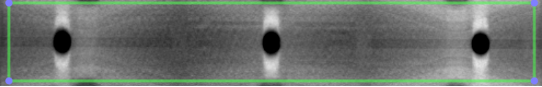
Faults of Sample 3 (CT scan). We can see parts of the stuck filler material on sample 3.
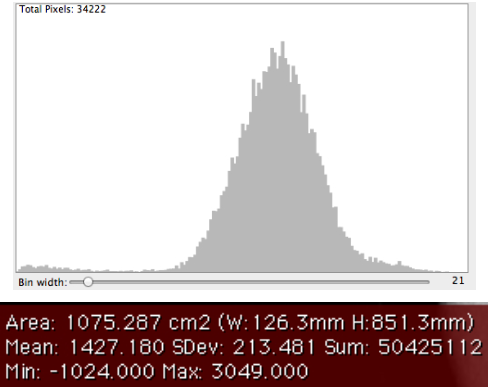
a, 1 minta
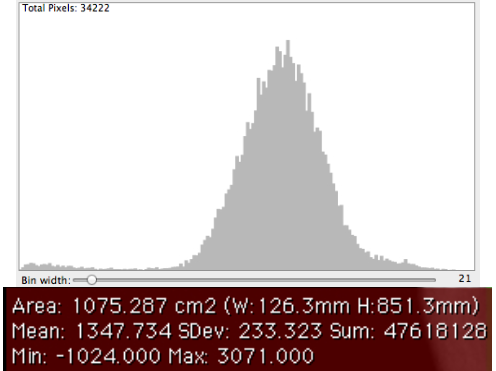
b, 2 minta
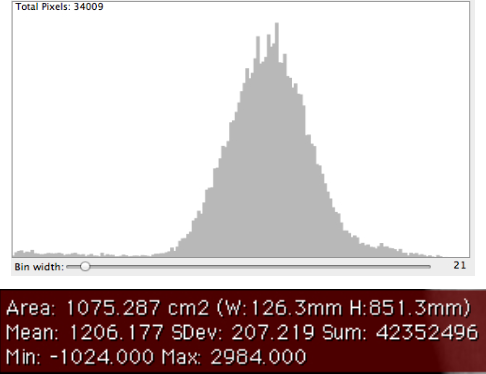
c, 3 minta
Distribution of Hounsfield values
Figure shows the distribution of Hounsfield values in the plane of the covering rubber material. The 1st intact sample (3.18 a) has a significantly higher Hounsfield average, i.e. the other two sample locations are thinned, separated and aged (3.18 b, c), this is also supported by the mechanical test results of the rubber material.